
The season in numbers
All figures are taken from the race calendar and the recorded results, nothing is extrapolated. Each race keeps the currency it is run for; sums and rankings are converted to US dollars at the rates of 16 September 2026.
90Group 1 races in the calendar90 run · 0 to come
US$94.4MTotal purse, calendar
15Racecourses
70Different winners
Richest Group 1 races
Prize money in US dollars1Pegasus World Cup Invitational StakesGulfstream Park · United States of AmericaUS$9.4M€ 8,235,6002Pegasus World Cup Turf Invitational StakesGulfstream Park · United States of AmericaUS$7.0M€ 6,138,6003Breeders' Cup ClassicSanta Anita · United States of AmericaUS$5.7M€ 5,051,200
4Kentucky DerbyChurchill DownsUS$4.5M5Breeders' Cup TurfSanta AnitaUS$3.8M6Breeders' Cup DistaffSanta AnitaUS$1.9M7Breeders' Cup Filly & Mare TurfSanta AnitaUS$1.9M8Breeders' Cup JuvenileSanta AnitaUS$1.9M9Breeders' Cup Juvenile FilliesSanta AnitaUS$1.9M10Breeders' Cup MileSanta AnitaUS$1.9M11Breeders' Cup SprintSanta AnitaUS$1.9M12Preakness StakesPimlicoUS$1.7M13Belmont StakesBelmont ParkUS$1.6M14Travers StakesSaratogaUS$1.3M15Kentucky OaksChurchill DownsUS$1.3M
Leaders
1Bricks And Mortar5 recorded G1 results5 winsUS$6.8M G1 prize money2Mitole4 recorded G1 results4 winsUS$2.5M G1 prize money3Midnight Bisou4 recorded G1 results3 winsUS$1.6M G1 prize money4Code Of Honor4 recorded G1 results2 winsUS$1.9M G1 prize money5Blue Prize3 recorded G1 results2 winsUS$1.5M G1 prize moneyView full ranking →
1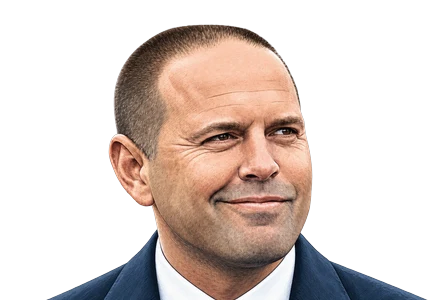 Chad C Brown34 recorded G1 results17 winsUS$14.4M G1 prize money2
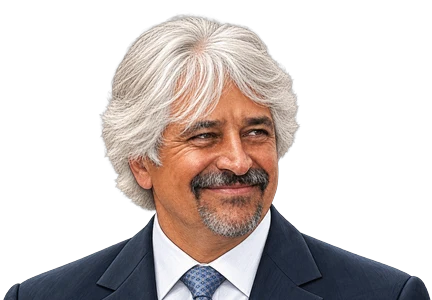 Steve Asmussen17 recorded G1 results11 winsUS$6.0M G1 prize money3
 Mark Casse11 recorded G1 results5 winsUS$3.7M G1 prize money4
 Brad H Cox9 recorded G1 results5 winsUS$3.2M G1 prize money5
 Bob Baffert18 recorded G1 results4 winsUS$6.1M G1 prize moneyView full ranking →
Chad C Brown34 recorded G1 results17 winsUS$14.4M G1 prize money2Steve Asmussen17 recorded G1 results11 winsUS$6.0M G1 prize money3Mark Casse11 recorded G1 results5 winsUS$3.7M G1 prize money4Brad H Cox9 recorded G1 results5 winsUS$3.2M G1 prize money5Bob Baffert18 recorded G1 results4 winsUS$6.1M G1 prize moneyView full ranking →1 Irad Ortiz Jr23 recorded G1 results11 winsUS$15.8M G1 prize money2
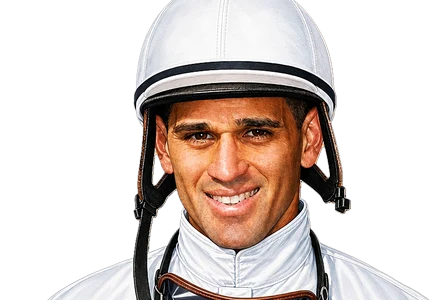 Javier Castellano18 recorded G1 results10 winsUS$9.6M G1 prize money3
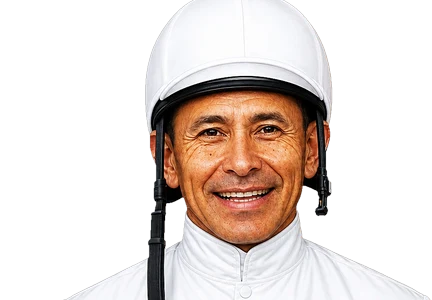 Mike E Smith17 recorded G1 results8 winsUS$5.2M G1 prize money4
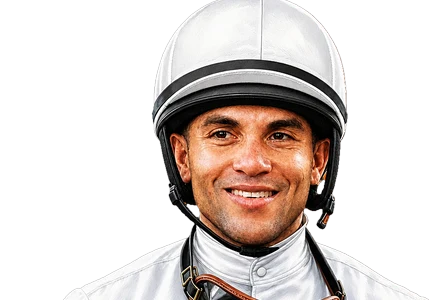 Joel Rosario21 recorded G1 results7 winsUS$8.4M G1 prize money5
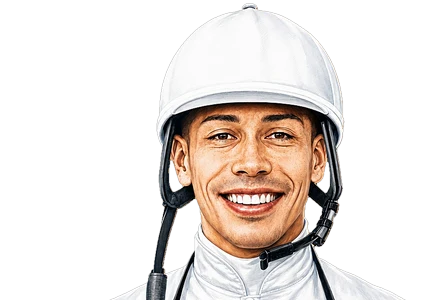 Jose L Ortiz24 recorded G1 results7 winsUS$6.9M G1 prize moneyView full ranking →
Irad Ortiz Jr23 recorded G1 results11 winsUS$15.8M G1 prize money2Javier Castellano18 recorded G1 results10 winsUS$9.6M G1 prize money3Mike E Smith17 recorded G1 results8 winsUS$5.2M G1 prize money4Joel Rosario21 recorded G1 results7 winsUS$8.4M G1 prize money5Jose L Ortiz24 recorded G1 results7 winsUS$6.9M G1 prize moneyView full ranking →1Klaravich Stables Inc & William H Lawrence2 winning horses6 winsUS$7.3M G1 prize money2L William & Corinne Heiligbrodt1 winning horse4 winsUS$2.5M G1 prize money3Hronis Racing LLC3 winning horses3 winsUS$2.7M G1 prize money4Gary Barber3 winning horses3 winsUS$2.3M G1 prize money5Bloom Racing Stable LLC, Allen Racing LLC & Madaket Stables1 winning horse3 winsUS$1.6M G1 prize moneyView full ranking →
1Giant's Causeway1 G1 winner sired5 winsUS$7.5M G1 prize money2Eskendereya1 G1 winner sired4 winsUS$2.5M G1 prize money3More Than Ready2 G1 winners sired4 winsUS$2.2M G1 prize money4Quality Road3 G1 winners sired3 winsUS$5.6M G1 prize money5Medaglia d'Oro2 G1 winners sired3 winsUS$2.5M G1 prize moneyView full ranking →
Group 1 racing across North America
Races by distance
90 races with a recorded distance4Sprintunder 1400 m
46Mile1400 to 1799 m
35Middle1800 to 2199 m
5Classic2200 to 2799 m
0Staying2800 m and over
Top racecourses
15 racecourses1Saratoga14 races
2Santa Anita13 races
3Santa Anita Park10 races
4Keeneland10 races
5Belmont Park10 races
6Del Mar8 races
7Churchill Downs6 races
8Woodbine5 races
9Belmont at Aqueduct4 races
10Gulfstream Park3 races
11Oaklawn Park2 races
12Parx Racing2 races
13Pimlico1 race
14Monmouth Park1 race
15Arlington Park1 race
By surface
1Dirt56 races
2Turf34 races
Worth knowing
Calculated from every recorded raceUS$1.0MAverage Group 1 purse90 races with a recorded purse
9.0Runners per race on averageacross 90 recorded fields
14Horses won more than onceof 70 different winners
37%Won by the three leading trainers33 of 90 Group 1 races